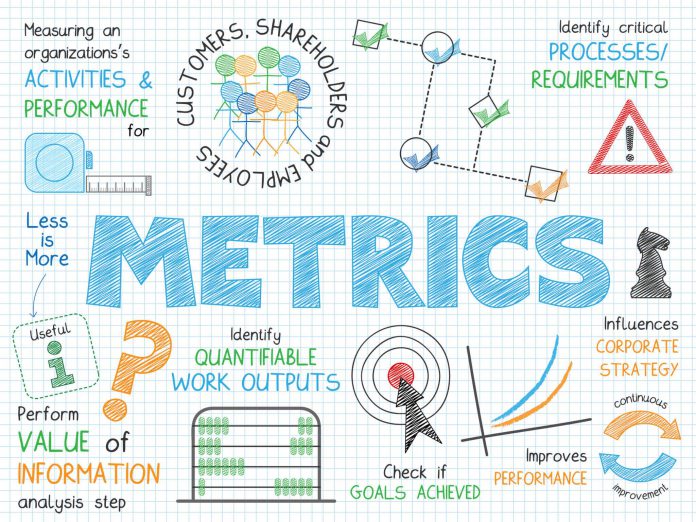
Businesses aim to build a successful product, or service, to sell and make their customers happy. This can be achieved if the company works in the right direction with perseverance. However, many among them face difficulties to achieve the next level of success and this is because they don’t keep a track of their business metrics.
To grow a business you need to make key decisions related to investment, finance, marketing, human resources, and business operations, etc. Business metrics, or Key Performance Indicators (KPI’s), helps in making a successful business and product launch, marketing promotions, making sales and planning for the future. Numerous business metrics can be tracked but the metrics selection depends on your business type, industry, and business goals.
What are Business Metrics?
Business metrics are used to track, monitor and analyze quantified measures that assess the business process’s success or failure. It helps in effective decision making for business management. It is important to note that business metrics address the business stakeholders, like; customers, managers, business owners, investors, and vendors.
Business metrics give you an insight into the business before making a deep dive into the core business data.
Each business department track, monitor and analyze their specific performance and key metrics. The sales department will cater to their respective metrics like sales volume, sales call, etc, while the marketing team will look after their respective metrics such as engagement, campaign costs, website traffic, etc. Many businesses and corporations talk about their favorite business metrics in the mission statements and some include them in their workflows.
What Business Metrics Should You Use?
As I have mentioned above that the business metrics address the stakeholders. It depends on the type of business, industry, business departments and business size. There are so many metrics that can easily confuse you and make more problems for you in decision making. The best practice is to see what metrics your competitors are most concerned about. Then make a list and use them for your business analysis.
To make your work easy, I have collected the most important business metrics that can help you get started without wasting your time. Each metric listed here contains a brief description, formula, and methodology.
There is no need to use all of the metrics stated below. Just use the ones that matter for your business and gives a meaningful picture of your business. Let’s jump into the business metrics. I have segmented the business metrics based on different departments.

Sales Metrics
1. Sales Qualified Leads:
The sales department is the heart of any business as it supplies the blood (money) to all other departments. Sales qualified leads are those prospects who have shown interest in the product you offer. These leads know your product and about to decide whether to buy your product or not.
Normally the sales qualified leads (SQL) are assigned a value depending upon their purchase intent. Tracking SQL’s will help you assess the effectiveness of your marketing and gives you a brief overview of product-market-fit.
The exact methodology to calculate a qualified lead, or sales qualified lead, depends on your sales funnel. This metric is a simple count of how many prospects showed interest to buy your product and helps in calculating the conversion rates.
2. Open Sales Opportunities:
The open sales opportunities are the qualified leads with which your sales team have touched base or just started working on them. This metric will tell you about the productivity level of your sales representatives and the level of importance they give to each prospect.
There is no such ballpark figure for this metric, as this depends on the sales rep skills and experience. If your sales pipeline lacks the required number of open opportunities then this shows that your sales team needs to connect with more prospects.
3. Closed Sales Opportunities:
It tells the number of open sales opportunities that are now closed by your sales team. This could be either due to prospect lost or sales win.
This is a helpful measure to know what time your sales team takes to close a prospect and gives a brief picture of the sales department’s progress. Moreover, it will show you the number of prospects that your sales rep has interacted with and closed.
4. Lead Response Time:
It is the average time your sales rep, marketing rep or customer support rep responds to the lead. This is more easy to understand for online businesses, as in this case, it will tell you how much time you take to respond to the website leads.
It is the average time your sales rep, marketing rep or customer support rep responds to the lead. This is more easy to understand for online businesses, as in this case, it will tell you how much time you take to respond to the website leads.
For example, you run an e-commerce store and a website visitor leaves a query on your contact form. You replied the lead after 15 minutes, which means your lead response time is 15 mins.
The smaller the number, the better it is for the Lead Response Time metric. Josh Harcus, author of ‘A closing culture‘, described how reducing the lead time helped grow his business revenue six times and reduced the sales cycle.
Lead Response Time (LRT)= Time gap in responding to a lead/ No of Leads.
5. Sales Win Rate:
The sales win rate is the percentage of the open opportunities that the business has won. It can be calculated for the whole sales team or individual sales rep. If you have 200 sales opportunities and your sales team manage to win 50 among them will give a win rate of 25%.
You need to make sure that you include only those opportunities to whom you have sent sales proposals and not the ones who are not contacted.
Sales Win Rate= (Number of sales opportunities won/ Number of sales opportunities contacted) *100
How to improve the sales win rate?
If your sales win rate is low, it means that you need to revamp your sales message, sales strategy or even your sales rep needs training (like product knowledge for sales team and rapport building techniques). This metric is really useful to learn about your business success and gives you a signal if changes are required.
Just keep in mind that your sales win rate depends on the sale deal size, referrals and leads availability. It is obvious that big deal size takes time to close and requires multiple touchpoints before a sales win.
6. Yearly Sales Growth Rate:
It is a good way to get an insight into the sales figure in the previous years. This will tell you how your sales are increasing in terms of a yearly basis. This metric will show you a picture of how your business has grown over the years or experiencing a downward trend.
Yearly Sales Growth Rate= [(Current Year Sale ($)- Last Year Sale ($))/Last Year Sale ($)]*100
Note: If you want to calculate the sales growth rate in terms of units then change the current and last year’s sales value to unit sold for each year.
7. Sales Value (Average):
This measure will let you know about the average deal size of your sales made to the customers and how much effort will be required to break even or meet the costs.
The best practice for using this measure is to segment your customers into large deals, medium deals and small deals (or as required by your business). This helps avoid skewness in the deal sizes and eliminating the effect of outliers.
Sales Value (Average)= Total Sales value ($) or Total Sales value in the segment/ Number of sales (units) or sales in the segment
8. Sales Cycle:
A sales cycle is the average time it takes to have a sales win. It is measured in terms of time like days, weeks or months. This measure will identify your bottlenecks and will let you know which segment in your sales funnel needs the most attention. Moreover, the sales cycle can help you identify the critical areas within your sales funnel.
Sales Cycle= Total time (days) spent on sales won/ Total number of sales opportunities
Note: Make sure that the total time spent on sales won is the cumulative time spent on all successful sales.
What is the ideal sales cycle for your business?
It solely depends on your business and industry in which you operate. This would be the result of your continuous learning and sales experience before reaching to point to identify your sales cycle.
It is usually hard to convert those potential customers who have crossed the average/ideal sales cycle. This is because they may lose interest in your product or offer, and might go to your competitors.
9. Net Promoter Score (NPS)
This is the most important business metric for your sales team. This is the measure of how likely your customers are willing to recommend your product or service to their others (friends and family).
It usually depicts the general perception of your customers for your brand. This metric is also used by the marketing and branding departments to help improve their campaigns.
There are different ways to calculate NPS but the most popular way to calculate it is with the help of a customer survey. The customer survey asks about how likely it is that they would refer your business, brand or product to their social circle.
NPS usually uses a scale of 0 to 10, with 10 being Extremely likely to recommend and 0 being extremely unlikely to recommend. You can measure the percentages of people from 0 to 6 as being the detractors and 7 to 10 as being the promoters. The difference among both percentages will give you the Net Promoter Score (NPS).
Net Promoter Score (NPS)= Promoters % – Detractors %
If your total detractors are 20% and total promoters are 50% then this means that your NPS is 30%. This measure gives you an insight into your loyal customers and the ones who are willing to spend more.
Marketing Metrics
10. Website Traffic:
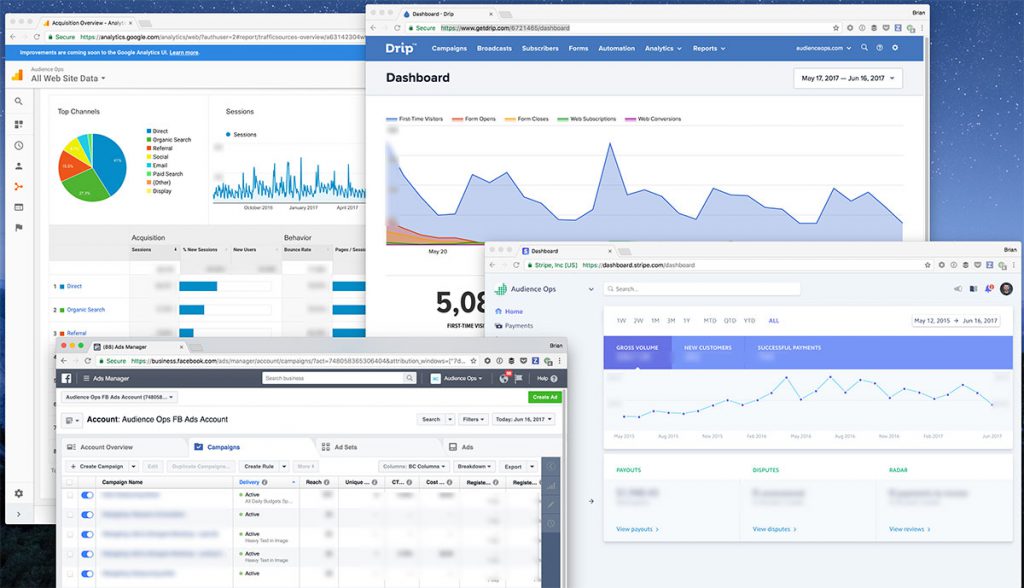
This is a very important metric for marketers and online businesses. It is simply the number of website visitors landing on your website domain. You can divide website traffic into numerous categories like website traffic from organic search, social media, referrals, unique visitors or repeat visitors, etc.
Marketer work to improve the website traffic to get more eyeballs. It is the same as to get more walk-in customers in your brick and mortar store. A website is the storefront of an online business. The more users you have the more traffic you can attract to your website.
There are several tools through which you can assess your website traffic such as Google Analytics, SemRush, Moz, Clicky, etc.
Note: These same tools like Google Analytics and SemRush are used to generate the other marketing metrics mentioned below.
11. Website Traffic Source:
This metric will tell you where your traffic comes from. There could thousands of different traffic sources but they all come under the categories of organic traffic, social channels, referral traffic, traffic from emails, direct traffic, and others (this can have traffic from any source other than stated above).
This will help you identify which traffic sources are working well for your business so that you can capitalize on that resource and see the problem sources that are not fruitful for you.
12. Backlinks (Inbound and Outbound):
Backlinks, the ones that link to other pages on your website and the ones that link to the external web pages apart from your domain, affect your website ranking. The health of the backlink is vital especially when you want to rank your website organically.
Backlinks affect your domain authority (DA), page authority (PA) and organic traffic. Your chances to rank higher on search engines like Bing, Yahoo and Google increase when your backlinks are healthy and give website visitors more value.
Online businesses use several backlink generation strategies but only whitehat techniques are fruitful. If your content is unique and gives value then other people will naturally link to your website. Guest posting and article submissions are among the most popular outbound backlinking techniques.
13. Keyword Ranking:
This is a critical metric that concerns the most to the digital marketers to know the organic ranking of their target keywords. There could many keywords used on your website, but there would be a chunk of keywords that brings in business from you in terms of money and traffic.
If your keywords position downgrades due to some reason like more competition then this will seriously affect your website traffic and hence your business revenues.
This metric tells you how well you are performing organically in terms of your organic competition. You can track keywords with the help of tools like Google Search Console, Moz, Ahrefs, SemRush, Serpstat and many more.
14. Website Domain Authority:
This is the overall value of your domain as given by the search engines. You can rank higher for the target keywords if your DA is high. It is a general indicator of your site’s health, performance, and traffic.
The DA is score is also dependent upon the age of the domain. Older sites can have a higher DA score. DA can be measured using tools like Moz, Kissmetrics, Ahrefs, and SemRush. In a few tools, the domain authority is also termed as domain rating.
15. Website Bounce Rate:
It is the measure at which the website visitors leave or bounces after landing on your website landing page. A user is called a bounced user who visits only 1 page on your website and leaves without going through more web pages.
A high bounce rate is scary as it means that the website visitors are not finding interest in your content or the product listed on your website. It helps devise customer and user retention strategies.
Website Bounce Rate= (Total number of users bounced after landing on a single webpage/ Total website traffic)*100
The ideal bounce rate depends on the industry and the type of the product. If you are offering an online tool then your bounce rate will be quite less. On the other hand, if you have a website that is based on project management tips then this might have a high bounce rate.
16. Conversion Rate
A conversion rate tells you how much website visitors converted to customers by purchasing your product online or by signing up. The conversion rate is dependent upon your overall business efforts and combining all the department’s work. As to have a good conversion rate you should align your content, marketing, sales, finance, planning, supply chain, logistics and project management teams.
Apart from this, the website usability and Click Through Rate (CTR) plays an important role in delivering a smooth conversion for your customers. Your landing page copy and signup forms functionality is also an important factor.
17. Incremental Sales Revenue:
If you want to calculate the revenue generated from the specific marketing campaign then this is the best-fit measure in this scenario. It offers a method to track the marketing performance as soon as the campaign ends and it is based on the Return on Investment (ROI) for that campaign.
Incremental Sales Revenue= Total sales ($)- Expected sales without the marketing campaign ($)
18. Customer Acquisition Cost (CAC):
Customer Acquisition Cost (CAC) tells how much does it cost to acquire a customer from your marketing efforts. This measure will tell you if you need to cut your marketing cost or simply leave out any costly marketing channel that fails to deliver the expected conversion rate.
Customer Acquisition Cost (CAC)= Total dollars spent on for customer acquisition/ Total number of customers acquired
19. Email Open Rate:
This metric is related to your email marketing campaigns. Your marketing team might be sending out several emails to your active and potential users such as email newsletters, promotion emails, and onboarding emails.
It is the rate at which your subscribers open the email received from your business. You might have heard that the ‘Money is in the list‘. So, if your customers are not opening your emails then it means that you are leaving a lot of money on the table. You can use any email automation and email client tool to measure the email open rate like; MailChimp, ActiveCampaign, Drip, etc.
The factors that lead to an improved email open rate are the subject line, personalization, email whitelist, and email client.
Email Open Rate= (Number of emails open for particular campaign/ Total number of emails sent in that campaign)*100
20. Social Media Followers:
This is an important measure if your business success depends upon strong branding. Strong brands keep a check on there social media followers on all platforms they utilize. The most popular ones are Facebook, Twitter, LinkedIn, Instagram, Tumblr, Snapchat, etc.
The social media followers work like the social tribe of the business and your competitors key a keen eye on this metric. So, you should focus on growing your followers and keep a check on it.
The social media tools have an in-built feature to classify your followers based on interests and demographics. This will let you know who you should target in your social posts. Businesses are more concerned about their social media follower’s growth rate.
21. Social Media Engagement:
Having a million followers on your social media pages with no engagement is a waste of time and resources. This will tell you what percentage of people are engaging with your social media content in terms of post clicks, post share, post comments, reviews, post likes and so on.
If more people are engaging with your content then it means that your social media page and posts will have more visibility, impressions, page views and brand interaction helping achieve your sales and marketing goals.
You can use several tools to automate your social media posting and improve engagement with the help of Buffer, Hootsuite, Tailwind, etc.

Financial Metrics
22. Profit Margin:
The main of any business is to earn profit. The profit margin is that part of the total revenue that has been accounted for all expenses. This metric will show you how your sales volume and pricing fit are resulting in your business in terms of the costs incurred.
If you have a low-profit margin then it means that either your price is low or your costs are high. So, you need to rethink what you offer and at what rate. This ratio doesn’t account for the costs incurred indirectly in your business operations.
Profit Margin= (Gross Profit ($)/ Total Revenue ($))*100
23. Cash Flow
It is a simple measure of the difference between cash inflow and outflow. It is a recurring accounting and finance activity for your finance department. The optimal cash flow level depends on the nature of your business. You will need more cash in hand if you run a brick and mortar store.
Cash inflow accounts for all the cash that comes in the form of sales revenue, investment and goods returned.
Cash Flow= (Total Revenue or Income + Business liquid assets gained) – (Total expenditures + Total gained liabilities)
24. Current Ratio:
It is a general measure that depicts if a company can pay off its debt. A current ratio of less than 1 means that the liabilities are more than the assets so it will be difficult for them to pay off loans. This ratio gives a brief overview of a company’s financial condition.
Current Ratio= Current Assets/ Current Liabilities
25. Accounts Receivables:
It is the money owed by debtors to your company for the products or services they have purchased from you. This usually results when you have to receive a large sum of cheque and you made a contract to sell a product or service on credit.
Accounts Receivable= Total outstanding invoices owed TO your business
26. Accounts Payable:
It is the outstanding amount your business needs to pay to complete the deal of the products or services purchased. To whom you owe outstanding payments are your creditors.
Accounts Payable= Total outstanding invoices owed BY your business
27. Quick Ratio (QR):
It is the ratio that tells about the liquidity of your business and incorporates those assets that can be easily converted into cash. If your quick ratio is 3.5 then it means that your business has $3.5 of liquid assets to cover every $1 of your liabilities.
It is good to have a quick ratio of more than 1.
Quick Ratio= (Current Assets+Accounts Receivable+Inventory)/ Current Liabilities
28. Gross Profit (GP):
Gross Profit calculates your business earning after accounting for the direct costs (Costs of Goods Sold (COGS).
Gross Profit (GP)= Total Revenue ($) – Costs of goods or services sold
29. Net Profit (NP):
Net profit is the part of the earnings that is left after accounting for all incurred costs (both direct and indirect costs). Such as taxation, interest payments, salary payments, and all other expenses.
Net Profit (NP)= Total Revenue ($) – Total Costs ($)
30. Gross Profit (GP) vs Net Profit (NP):
The Gross Profit vs Net Profit metric is mostly used for making comparisons and used when making analytical reports. This comparison shows which costs, either direct or indirect, effects the most to your profit levels. This is used in comparison to the target profit ratio to depict a clear picture of the actual versus forecasted metrics.
31. Gross Profit Margin (GPM) Ratio:
GPM is a profitability measure that shows by what percentage the cost of goods sold (COGS) is less than the total revenue. It shows the efficiency and effectiveness of your business to minimize the cost directly involved in the production or delivering services.
Gross Profit Margin (GPM) Ratio= ([Total Revenue- Cost of goods sold]/Total Revenue)*100
32. Net Profit Margin (NPM) Ratio:
It is the ratio of net profit in terms of revenue for your business. It depicts how each dollar earned translate into profit.
Net Profit Margin (NPM)= ([Total Revenue – COGS – Operating Expenses]/Total Revenue)*100
33. Working Capital:
The working capital shows the immediate ability of your business to pay short term debts. It is simply current assets minus current liabilities. A positive number shows you that your business can pay off short term debts, while a negative metric shows the inability of making short term payments.
Working Capital= Current Assets – Current Liabilities
34. Debt to Equity (D/E) Ratio:
A Debt to Equity ratio tells you how much of your company’s capital is generated by the debt apart from shareholder’s equity. A low debt to equity ratio is more favorable for your business so it means that your company is funded more by external sources.
Debt to Equity (D/E) Ratio= Total liabilities/ Total shareholder’s equity

Human Resource (HR) Metrics
35. Absenteeism Rate:
This tells about how often your employee takes a day or days off. The employees may take days and take leave from work. Planned leaves are encouraged at many organizations and taking many unplanned leaves is not considered a good work practice.
It is recommended to include only the unplanned leaves in the absenteeism ratio to avoid placing false blames on your employees.
Workers Absenteeism Rate= (Total (unplanned) Leaves/ Number of working days in a given time)*100
36. Employee Turnover Ratio:
Employee Turnover ratio is the rate at which your employees voluntarily leave working for your company (Fired employees are usually not included in this ratio). A 10 to 20 percent employee turnover ratio is considered acceptable but it is a good practice to benchmark the industry standards.
Employee Turnover Ratio= Number of employees who left working for your company/Total Number of Employees
37. Employee Engagement Rate:
If you want to make your teams productive then you should improve employee’s engagement rate. Engaged team member works more efficiently and can prove to be much fruitful for the business. This in short helps in satisfying your employees more than paid incentives.
Engaging employees is about to add a human touch to your work environment. You can conduct several employee meetups and engagement activities on the job to boost their morale and urge them to engage more.
There is no single formula to measure the employee engagement rate but you can create a short employee engagement survey to find out how much employees and their managers feel that they are engaged on the job. You can ask about what they think about their work-life balance? And what value they value as an employee?
38. Employee Satisfaction Level:
Employee Satisfaction metric has a slight difference with the Employee Engagement rate. An engaged employee is more willing to participate in business process improvement and put more effort to achieve business goals. While a satisfied employee helps in advocating the business brand and helps in making a positive workplace environment.
Employee Satisfaction Surveys can be used to find out the employee satisfaction level on a scale of 10. Though the satisfaction level might change for each employee with time but keeping a periodic track of it helps the company to improve its employee retention rate.
39. Average Time To Hire:
It is the average time it takes to complete one average hiring cycle, i.e, from initial screening interviews to employee onboarding. This metric is kept as a benchmark figure that helps in making HR decisions that from the company’s experience how much time would it take to make a successful hire.
Average Time To Hire (Days)= The day at which candidate was first interviewed – The day the candidate joined your company
40. Cost Per Hire:
If your HR department takes too much time to fill the required position could cost your business in terms of opportunities lost and the cost of HR functions will increase per hire.
Sometimes many businesses waste a lot of money to make the so-called ‘A Perfect Hire’, by paying to external hiring and recruitment companies and paying to the job boards. Cost per hire is a key cost metric for the HR function of the business.
Cost Per Hire= (External Recruiting Expenses + Internal HR Expenses)/ Total Successful Hires In The Given Period
41. Per Employee HR Cost:
It is simply the cost of the HR department or team with the total number of HR staff. The cost includes the HR team’s overall salary plus all the benefits given to the team. This will tell how much your HR team costs to your business and you can analyze the overall picture by making a comparison with the other HR metrics.
Per Employee HR Cost= (Cumulative HR Team Salary Cost + Benefits Given To HR Team)/ Total HR Team Members On Your Payroll
42. Employee Training Cost:
Training is necessary for your team to perform their job successfully but training needs some investment in human capital by business management. Your business should make sure to track individual employee’s training cost. This will help in creating your yearly HR budget.
Employee Training Cost= Total expenditures on employee training/Total number of employees
43. Revenue per employee (R/e):
This is a clear cut way to find out how much revenue per employee you are generating. It gives a ballpark figure of your workforce performance. This metric depends on the team size. There are companies, especially in the tech sector which have less than 10 employees but generating millions in revenue.
Your team productivity will be depicted by this metric and it will also help you in doing the cost-benefit analysis.
Revenue per employee= Total Revenue ($)/ Total staff size

Project Management Metrics
44. Productivity (Team or Individual):
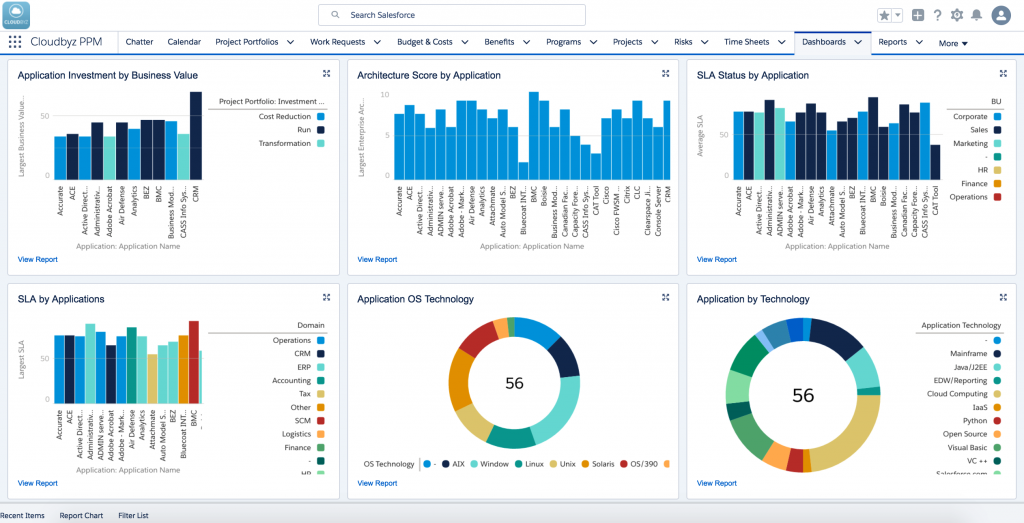
You are quite familiar that productivity tells about the capability of your employee or the team as a whole. It helps you in decision making about how much stuff you need to get the project running. It also shows how well your resources are used and helps in optimizing the ROI.
Productivity= Output/Input
The productivity ratio can be calculated for an individual team member, whole team and cross-teams as well. Though, you need to keep different criteria of productivity depending upon each business function.
As for the sales team, the input would be the number of sales calls made and output would be the number of sales-qualified leads, and similar criteria for input and output can be decided by your business management.
45. Actual Start Date:
It marks the start of the project schedule and helps to compute the schedule variance. Using this metric project managers can calculate the productivity of each team member and analyze the planned versus actual statistics. All the projects have an Actual Start date and it must be recorded to use in other metrics.
46. Project Earned Value:
The project earned value will tell you about how much value you have generated for the given project. It is simply a comparison of the work completed with the approved project budget.
Project Earned Value is also sometimes referred to as ‘Budgeted Cost of Work Completed’. This metric is usually considered during the project tenure to check the progress.
Project Earned Value= Percentage of Work Completed/ Approved Budget for the Project
47. Project Actual Cost (PAC):
The project actual cost will show you the actual amount spent on the given project. All the expenditures are added to calculate the actual cost over the period.
Project Actual Cost (PAC)= All Direct Costs + All Indirect Costs
Note: It is favorable to include the cost when they are incurred. Planned cost in the project is excluded in this actual cost metric.
48. Planned Cost for the Project:
The planned cost is suggested in the project budget report before actually starting the project. This metric is then compared with the actual cost to see the differences.
Planned Cost= All Planned Direct Costs + All Planned Indirect Costs
49. Cost Variance:
The cost variance is a business metric that will calculate the difference between the actual and the planned costs with a given time. This will prove the effectiveness of your project planning and will tell you whether the actual cost is higher or below the planned costs.
It is favorable to have a positive cost variance means that the project goes under the budget. Moreover, the planned costs also cater to the inflation rate and keep a cost margin to avoid any issues.
Cost Variance= Planned Cost of the Project – Actual Cost of the Project
50. Project Schedule Variance:
In meeting the deadline your core focus will be on tracking the project schedule variance. It gives you a variance of the planned versus scheduled project. It is the difference between the Project Earned Value and the Project Planned Cost.
Project Schedule Variance= Project Earned Value – Planned Cost for the Project
51. Cost Performance Index (CPI):
It is an efficiency metric for the project that how the actual cost has performed for the project in the given time. You can calculate this index by dividing the project earned value with the actual cost.
Cost Performance Index (CPI)= Project Earned Value/Project Actual Cost
52. Schedule Forecast:
Schedule Forecast is the prediction of the events in the future that might affect the project and it is calculated at the current time. Forecasts are usually updated based on the project performance with time.
It is derived from the baseline of the schedule and calculated using the estimated time to completion (ETC). It is expressed in terms of Performance Index and Project Schedule Variance. Therefore, you will require a project calendar and schedule model to compute the forecast.
53. Critical Path (CP):
It is a very important term used in project management and requires much attention when projects are planned. By definition, a Critical Path (CP) represents the longest path to complete the entire project.
It includes every activity that must be performed to get the desired project result. A critical refers to the scheduling order that makes a complete project. It helps in pointing out which activity could delay the project delivery date.
Other Important Business Metrics
54. Total Customers:
Businesses aim to generate a healthy customer base to earn higher profits. A business should keep a track of their entire customer base (with their customer profiles) for use in planning and forecasting. Therefore, you should aim to grow your total number of existing customers each year to remain.
55. Customer Retention Rate:
This is the ratio of how many customers does your business can retain and continued to contribute to your revenues. You should aim to maintain a healthy customer retention rate to improve your customer lifetime value and grow your business.
Customer Retention Rate (CRR)= ([Existing number of customers – No. of Customers at the start of the year]/ No. of customers at the start of the year)*100
56. Customer Churn Rate:
It is the rate at which your customers are leaving to use your products or services and churn is the number of customers lost in the given time. Calculating customer churn is important and this depicts the performance of your entire business team including marketing, sales, product team, etc.
Customer Churn Rate= (Number of customers lost/ Number of customers at the start of the year)*100
57. Average Customer Revenue:
It is essential to know the average customer revenue to help in designing your upselling strategies used by the marketing and sales department. It is simply a measure of total revenue with the total number of customers.
Average Customer Revenue= Total Revenue/ Total Customers
58. Customer Lifetime Value (CLV):
This business metric is an estimated total revenue a business can expect to receive from a single customer. Businesses calculate the CLV using different methods but usually, they analyze their past customer data to get a more accurate CLV metric.
Some businesses make different customer segments and generate CLV for each segment. This number is based on the average time a customer is expected to stay with your business and depicts your customer journey.
Customer Lifetime Value (CLV)= Contribution Margin * (Retention Rate/[1+Discount Rate-Retention Rate])
Note: The above-mentioned formula is one of the methods to calculate the CLV. There are several other ways to calculate CLV. Check details about CLV here.
59. Monthly Recurring Revenue (MRR):
It predicts an estimated revenue a company will generate each month based on the number of current customers (assuming your existing customers won’t leave). This metric is more popular among SaaS companies.
Monthly Recurring Revenue (MRR)=Total revenue from existing customers in the last month
60. Annual Recurring Revenue (ARR):
It is the same as above but this metric is spread out to an entire year. It is an estimated revenue value a company is expected to generate each year.
Annual Recurring Revenue (ARR)= Total revenue from existing customers in the last year
More Reading:
16 Metrics to Ensure Mobile App Success
Part 1 Performance Metrics
Part 2 User and Engagement Metrics
Part 3 Business Metrics


